| |
|
|
INTRODUCTION
The allergy is a disorder of an individual’s immune system, i.e.
a negative reaction to external stimuli that are completely harmless
to most people. The term allergy is of Greek origin and was formed
by joining the word alos = altered and ergeia = reaction. The
spectrum of allergy cause is very broad, ranging from substances in
the environment (pollen, dust, sun etc.), animals, medicines, food
etc. [1]. A special segment of this problem is reactions to food
allergens. The food represents human's primary need, thus it is
necessary for maintaining life and health of people. Also, food is a
source of satisfaction, especially in richer societies with
diversity of food offer. While for majority food is a source of
pleasure, for individuals, food may represent a danger leading to
unpleasant reactions, and even to death in the most extreme cases
[2]. The allergic reaction to food is defined as a disorder that is
a consequence of IgE-specific immune response that re-occurs after
the exposure to a particular type of food [3]. Although food
allergies have been known for a long time, this problem has
attracted more attention in the last twenty years. It is interesting
to note that Hippocrates, father of medicine, had already observed
and described some allergic reactions to food 2000 years ago [4].
Food allergens are natural proteins that are resistant to effects of
heat, proteolytic enzymes and pH change. An individual’s immune
system may react with a very small amount of allergens present [5].
Generally, allergies are looked upon as a major health problem, but
there is also perception that prevalence and severity of symptoms
are increasing. According to available data and studies, the
prevalence ranges from 1-3% in adults and even up to 8% in children
of up to 3 years of age [6].
Food allergies represent disorder that is more and more talked about
worldwide. The prevalence is generally from 1-7% of the total
population. The importance of individual allergens depends on age,
while prevalence of individual allergens depends on geographical
area. The most common allergens in infants and children under 3
years of age are milk and eggs. In the USA, peanuts are very common
cause of allergies in younger population, while this allergy is
completely unknown in Greece. Fish allergies are common in Spain and
Japan, while sesame allergy is common in Israel. In France, mustard
is one of major allergens. Each geographical area has its own
characteristics when it comes to frequency of allergies and
prevalent type of allergen [7]. Generally, the incidence of
allergies and types of allergens change over time. The problem of
food allergies has evolved from being individual problem to becoming
a significant healthcare problem. Although the incidence of
allergies is very different (as is the type of allergen) by
individual regions worldwide, it is estimated that about 25% of the
population is already at risk [8]. Given that the only way to combat
allergies is to avoid food allergens, it is clear that knowledge and
information are of great importance to allergic persons. In this
regard, legislation is of great importance for safety and health of
these individuals. That is why the work is still ongoing to improve
the laws governing this area.
For EU (European Union) Member States, the EC (European Commission)
directives and regulations are binding, with the possibility for
each country to amend its laws according to its specific needs. One
of the ways is to adhere to the list of binding allergens on food
product declarations [9].
OBJECTIVES OF THE PAPER
Establish whether there is a problem with food allergies in
Sarajevo Canton.
Establish the frequency of some other allergies in subjects.
MATERIAL AND METHODS
This cross-sectional study of food allergies was conducted during
March and April, 2017 among residents of Sarajevo Canton of all age
groups and by random sampling method. Special survey questionnaire
was designed, and it was filled in by 480 subjects. This research
was conducted retrospectively. As previously mentioned, the research
was conducted based on the survey questionnaire. The research was
performed of the available data on studies conducted in BiH and the
region, concerning the food allergy prevalence. “Food Allergy“survey
questionnaire was prepared and it consisted of 16 questions answered
by the subjects. So, the questionnaire had been created specifically
for this research in Sarajevo Canton, i.e. all population categories
were included. The survey of the subjects is conducted in the
following ways: (1) Direct interview with a subject; (2)Contact with
subjects vie e-mail; (3) Via social network (Google Disc). Direct
interviewing of subjects was conducted in order that research would
comprise all age-related and social groups of Sarajevo Canton
population, as well as to obtain data for certain number of families
with all their members. The research was conducted in the period
March – April, 2017.
Statistical data processing : The research results are presented in
accordance with the filled in questionnaire, in the form of absolute
numbers (N) and percentage values (%). Statistical data processing
was done using the statistical calculator “Social Science
Statistic“. For the nominal variables, Chi-Square Test and ANOVA
test were used. P value <0,05 was considered statistically
significant.
RESULTS
The total number of subjects surveyed in Sarajevo Canton is 480.
Of the total number of surveyed, 168 (35%) are male persons, and 312
(65%) are female persons. The number of female subjects is
significantly higher than number of male subjects (Chi-Square Test,
χ2 =22,0972, p= 0,00003; for p < 0,05)
The number of subjects under 18 years of age was 37 (8%) and was
significantly lower than the number of adults: 443 (92%) (Chi-Square
Test χ2 = 209,1042, p < 0,05)
Chart 1: Structure of subjects in terms of the
frequency of any type of allergy
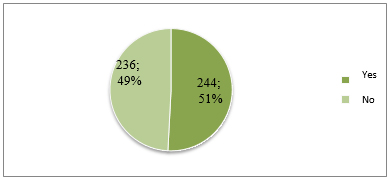
Of 480 subjects, 244 subjects (51%) gave a positive answer, while
236 (49%) subjects gave a negative answer, i.e. there is no
significant difference between the group with allergy and the group
without allergy (Chi-Square Test: χ2 = 0,0667; p= 0,796246, for p<
0,05)
Chart 2: The frequency of food allergy in all
subjects
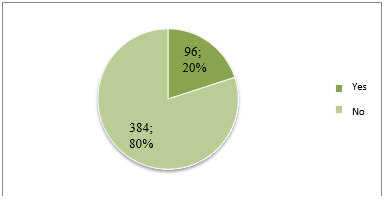
Of 480 subjects, 96 (20%) answered that they had a food allergy,
i.e. 384 (80%) answered they did not have a food allergy, which
represents significant difference between these two groups of
subjects (Chi-Square Test: χ2= 94,9451, p<0,05).
Chart 3: The frequency of food allergy by gender
and age
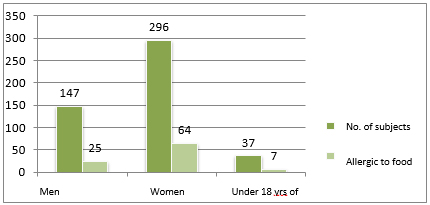
Of the total number of men (147), 122 (83%) of them are not
allergic to food, while 25 (17%) of them are. Among women, the
number of those allergic to food is 64 (22%), while among younger
ones – under 18 years of age, the number of those allergic to food
is 7 (19%). Percentage of men, women and children is not
significantly different (Chi-Square Test: χ2 = 1,3366; p = 0,512568;
p <0,05). Of 480 subjects, 244 confirmed some form of allergy, and
of those 244,96 (39%) also have a food allergy, while 148 (61%) have
some other form of allergy. Subjects allergic to food (96 of them),
in 49% of cases are allergic to other allergens, too. There is no
significant statistical difference between these two subject groups
(food allergies only and food allergies in combination with another
form of allergy). (Results of Chi-Square test are: χ2= 0,0208; p=
0,885228 ; p >0,05)
Table 1. Presentation of foodstuff subjects are
allergic to
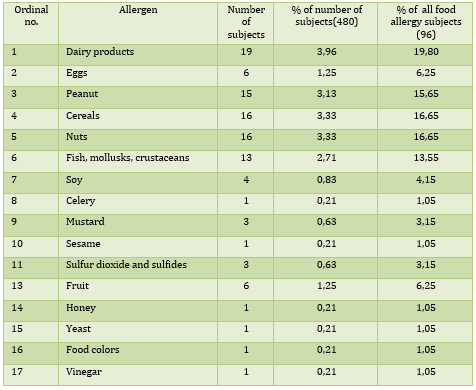
Presentation of structure of frequency of allergens in food: most
commonly allergies are reported to be to dairy products (3,96%),
then to cereals and nuts (3,33% each).
Chart 4.: How long does it take from allergen
intake to occurrence of allergy symptoms?
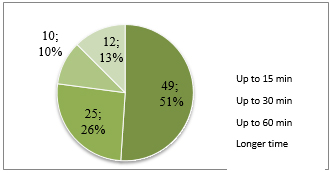
According to presented chart, most commonly reactions occur
immediately (within 15 minutes) in 51% of subjects, then after half
an hour (25%). Of 96 subjects with food allergy, 29 of them (30%)
were hospitalized due to allergy, while 67 (70%) were not. There is
a significant statistical difference between these two groups of
subjects (Chi-Square Test: χ2= 7,8274, p= 0,005146, for p< 0,05).
Of the total number of subjects with food allergy, 56 (58%) of them
were diagnosed, while 40 (42%) of them were not, which represents a
significant statistical difference between these two groups
(Chi-Square Test: χ2 = 1,3427, p= 0,236566, for p< 0,05).
Chart 5. Structure of subjects according to the
answer to the question: In which way were you diagnosed a food
allergy?
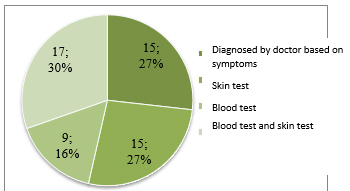
Out of the total of 56 subjects with accurate diagnosis, 15 (27%)
of them did a skin test, 15 (27%) of them did a blood test, and 9
(16%) of them did both skin and blood test, while 17 (30%) of them
were diagnosed based on symptoms without any additional tests. Types
of test, i.e. way of diagnosing does not show any statistically
significant difference (Chi-Square Test: χ2= 1,7629, p = 0,623037;
for p< 0,05).
In 55 cases (57%) the subjects allergic to food have family members
with some allergy, which does not represent statistically
significant difference in relation to the group of subjects whose
family members do not have allergies (Chi-Square Test: χ2= 1,0263, p
= 0,311032 , for p <0,05%).
The subjects gave the following answers to the question related to
whether they check the contents on food articles:
Chart 6. Structure of subjects according to the
answer to the question: if you are allergic to food, do you check
contents on declaration?
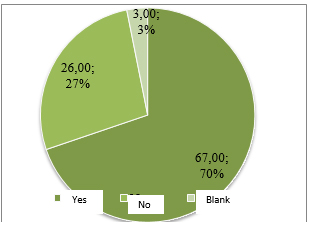
Chart 7. Structure of subjects according to the
answer to the question: if you are not allergic to food, do you
check contents on declaration?
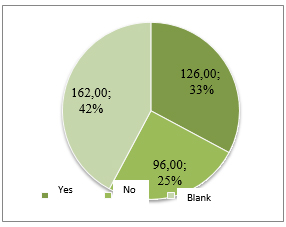
Declarations, i.e. ingredients in food items are checked by 70%
of persons with food allergies, while that percentage is only 33% in
subjects without food allergies. From the above-mentioned, we
conclude that there is statistically significant difference in
habits of reading declarations in allergic persons and those who are
not allergic (Chi-Square Test: χ2 = 60,3412, p < 0,00001, for p<
0,05). The subjects with food allergies are not generally satisfied
with allergen labelling (70% of cases), while 21% of subjects are
satisfied with current situation, and 9% of them did not answer this
question.
Table 2: Impact of allergies on life quality
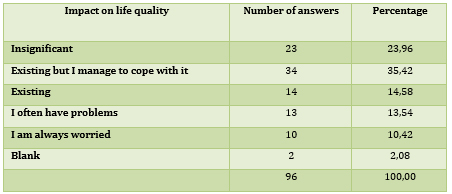
Regarding the question of impact of allergies on life quality,
significant difference exists between individual categories of
answers. Majority of subjects have problems, but they manage to cope
with it (34 subjects, or 35,4%), while smallest number of answers
(10 subjects or 10,4%) is related to category “I am always worried”
(χ2 = 40,915, p<0,0001, for p ≤ 0,05).
DISCUSSION
The food allergy survey conducted in Sarajevo Canton comprised
480 subjects. Of the total number of subjects, 443 were adults or
92%, while those under the age of 18 were 37 or 8% (Chart 2). In the
group of subjects, male persons were represented with 35% (168), and
female persons with 65% (312) (Chart 1). Although there is
significant difference in the number of females and males, this did
not affect the survey results. There is no difference in the
frequency of food allergies in terms of gender, and there is no
significant allergic difference in gender in any of the studies
available to us.
Out of 480 subjects, 244 (51%) of them reported having some form of
allergy (pollen, house dust, hair, medicines, food, sun etc.), while
96 (20%) of them reported food allergies. Of the total number of
allergy cases, the food appears as allergen to a significant extent
in 39% of cases (Chart 6). Of the subjects allergic to food (total
of 96), 49 (51%) of them have only food allergy, while the remaining
47 (49%) have also some other forms of allergies (Chart 7). In
adults, the largest number of allergies is related to inhalation
allergies and they develop as a consequence of IgE sensitivity to
aeroallergens, with cross-reaction to food. Persons with allergy to
pollen, latex, house dust and so on, have also cross-allergies to
food of plant origin: fresh fruit, nuts and vegetable. Even 40% of
adults allergic to pollen also have allergy to food of plant origin
[6]. Some other studies state that prevalence of allergies to food
samples is conditioned by geographical position, socio-economic
conditions and eating habits. It has been known for a long time that
food allergy affects children more than adults. Based on these
researches, prevalence of allergic reaction to food is about 5% in
adults and 8% in children, and these numbers are still increasing.
As possible risk factor, they mention gender, vitamin D
insufficiency, malnutrition and obesity, increased hygiene,
genetics, atopic diseases, increased use of antacids, exposure time
to allergen and so on. The most common allergens in child population
are cow milk (2,2%), peanut (1,8%) and nuts (1,7%), while in adult
population, these are mollusks (1,9%), fruit (1,6%) and vegetables
(1,3%) [7].
The allergic reaction may be result of consumption of food with
allergen, inhalation of vapors or contact with such food. Reactions
vary from mild symptoms, such as rash and burning sensation to very
difficult conditions such as anaphylactic shock [8].
Patients allergic to pollen often have cross allergy so they feel
oral and pharyngeal allergic symptoms while eating fresh fruit and
vegetables [10] .
In 2007, research of food allergies was conducted in children
younger than 6 years of age in the area of city of Osijek, Republic
of Croatia. The questionnaire was filled in by 810 parents, and the
result obtained is that 5,4% of children are allergic to food. The
most common causes of allergies are food additives, eggs, peanut and
milk, and then honey, pesticides, fish and gluten. Conclusion of
this research is that allergies develop in children in pre-school
age (with high percentage of food additives as allergy cause of
nearly 41%), and that correct food labelling is of great importance
due to a need to exclude dangerous foodstuff from nutrition [11].
Another research conducted in 2014 also in Republic of Croatia,
Vukovar-Srijem Parish (General Parish Hospital) comprised infants
0-1 year and young children of 1-4 years. The research included 59
subjects suspected to have allergy to cow milk. After conducted
testing, (determining specific IgE antibodies by standard
immunofluorescent test), allergy was confirmed in 35,6% cases.
Conclusion of the research is that allergy to cow milk is common in
observed population, and that diagnosis is established relatively
late. Higher percentage of allergy is established in boys of this
age, as well as in children who live in villages [12].
In the Alergology Department of Clinic for Skin Diseases at
University Clinical Center Tuzla, in 2009 and 2012, the patients
(224 and 316 patients respectively) underwent intradermal testing.
In the interval of just two years, significant increase of patients
was observed and they were sensitized to specific allergens in food.
As possible causes of increased number of cases of sensitivity,
authors of the study mention changes of food allergenicity, lower
standard of inhabitants and poor food quality, changes in eating
habits and so on. In order to make more solid conclusions, it is
necessary to conduct researches in longer period of time. According
to data of this study, in the area of Tuzla Canton, in 2012, the
most common positive food allergens were: vegetable (beans, peas and
potatoes), mushrooms, flour, drinks (cocoa, coffee, green tea) and
fruit [13].
Obtained results of food allergy prevalence in our research in the
total number of subjects (20%) suggests that the problem of
allergies in the Sarajevo Canton area is significant, and that the
frequency is in the values which are characteristic also for other
regions in Europe and the world. For example, in Great Britain, the
percentage of persons (all ages) allergic to food is 20% (Young,
1994), in Germany, it is 34,9% (Zuberbier, 2004), in France, it is
3,24% (Kanny, 2001), in USA, it is 28% (Bock, 1987), in Holland, it
is 12 % (Jansen, 1994), in Spain, it is 4,6 % (Woods, 2001), in
Australia, it is 19,1% (Woods 2001), in Denmark, it is 13% (Osterballe
2005) etc. All presented data relate to self-reported cases,
regardless of whether the subjects were diagnosed or not [7].
Research (Lee, 2017.) in Korea established that food allergy
prevalence is very individual; it is a result of impact of culture,
age, ethnicity and eating habits [14]. Generally accepted opinion is
that food allergy prevalence has been on the increase in the last
decades, in particular in western countries, but high quality
evidence based on a diagnosis confirmed by testing regarding food
allergy which would support this presumption is lacking, due to high
cost and potential risks related to conducting a food test in
broader population [15].
With regard to the issue of allergens in our research, the largest
number of subjects, as in most researches available to us, was
allergic to milk and dairy products (19 cases), cereals and nuts (16
cases each), followed by eggs, mollusks, fish, crustaceans, fruits
and other. Of 14 allergens defined by statutory regulation as
allergens that have to be labeled, the subjects reported allergies
to everything on this list, except for lupine, while some others
were added (Table 1).
Of the allergens that are not on the list - fruits, vinegar, honey,
yeast and food coloring were reported. Nearly 3% of subjects
answered they were allergic to other foods (which are not on the
priority allergens list), without mentioning exactly the foods they
were allergic to. Given that about 3% of subjects mentioned the
foods not listed on the list prescribed by law, there is a need to
conduct research in the area of BiH which will provide more data on
these allergens. The tests conducted in Europe show that the most
commonly reported allergens (not listed) are as follows: vegetables
and mostly peas, tomato, spinach, eggplants and carrots, followed by
chocolate, garlic, honey, pork, black pepper, pickled cucumbers,
cocoa, potato, sugar, chicken and beef. So, Zuberbier (Germany,
2004) reports on prevalence of 1,8% for vegetables, while other
studies (Gelincik 2008, Turkey; Mustafayev 2012, Turkey; Osterballe
2005, Denmark; Venter 2008, Great Britain) show prevalence of less
than 0,5% when it comes to other allergens [16].
The percentage of allergens reported by subjects in our survey is in
the range which is defined as the average by individual studies. The
European Academy of Allergy and Clinical Immunology (EAACI) Project:
in 2014, the results of the study on the prevalence of food
allergies in Europe by the EAACI expert group for food allergies,
were published, and based on reviews of available studies conducted
in the period from 2000-2012. Although the researchers dealt with
very heterogeneous studies, an overview of frequency of basic
allergens was made. The most common allergy is to cow’s milk, wheat,
eggs, followed by nut products, according to subjects’ statements,
and confirmed by oral food test [17].
Studies conducted in Great Britain relate to different age groups of
children younger than 15 years of age. Prevalence for self-reported
cases is from 11-33%, while percentage of allergies confirmed by the
test is significantly lower (1-5 %). The most common allergens are
eggs, milk, wheat and peanut [18], [19]. There is a lot of data
suggesting that food allergies are common (comprising up to 10% of
population), and prevalence has increased during the last three
decades, but it seems that it disproportionately comprises persons
in industrialized/western regions. They are more common in children
in comparison to adults [20].
Our survey showed that of 96 food allergy cases, 56 (58%) were
diagnosed, while 40 (42%) were not diagnosed, which did not
represent significant statistical difference.
According to the answers of subjects, allergic reactions occur most
commonly within 15 minutes after consumption (or contact, i.e.
inhalation of the smell) of food, and this happens in as many as 51%
of cases; within 30 minutes it happens in 26% of cases. Of 96
subjects, who report food allergy, 29 (30%) stayed in hospital due
to the allergy. Of 56 subjects who were diagnosed with allergy, 15
did skin test, 9 did blood test, 17 did both tests (skin and blood
test), and 15 were diagnosed by a doctor based on the symptoms.
Based on the answers by subjects, it was concluded that all
mentioned diagnostic methods were used, and statistically, there was
no significant difference in listed tests regarding their use.
Percentage of diagnosed allergies is 11,67% in relation to the total
number of subjects (480).
Taking into consideration that allergy cases often occur in several
family members, this survey shows the datum that in 55 cases persons
with food allergy also have some other family members with some
allergy, which does not represent significant statistical
difference.
Persons with food allergy apply elimination diets, i.e. they avoid
taking food items they are allergic to. That is why clear and easily
legible labelings are much more important to them. The survey showed
that. When asked whether they read labeling on products, nearly 70%
of subjects answered YES, while 33% of subjects without allergy gave
that answer. Only 3 persons with allergy did not give answer to this
question, nor 162 persons without allergy. When asked whether they
are satisfied with allergen labeling on food products, of 96 persons
with allergies, only 20 (21%) were satisfied, while 67 (70%) were
not satisfied. Reasons of customers’ dissatisfaction were not
examined in this survey.
Also an online survey conducted in Great Britain (Anaphylaxis
Campaign, 2005 and 2006) with a similar question (the question was:
How good or bad do you assess the current system of labeling for
allergic persons?”) showed the following similar results: very good
0,8%, pretty good 32,5%, fairly bad 39,1%, very bad 26,3% and I do
not know 1,3%. The answers fairly bad and very bad together make up
65,4%, while in our survey this percentage is 70%. One of the
conclusions of this research is that it would be much easier for
consumers to make a decision if preventive warning was defined, as
well as the way of preventive warning that all the manufacturers
would use in the same way.
One of the most important projects implemented in order to collect
the data on food allergies in Europe is the EuroPrevall (The
Prevalence, Cost and Basis of Food Allergy across Europe) project.
It was financed by EU, project implementation started in 2005, and
it lasted nearly 5 years. 63 partners from 23 countries were
involved in the project, as well as collaborators from North
America, Australia, New Zealand and Africa. The researches were
carried out in accordance with legally adopted list of allergens in
that period, as well as with some new foods that proved to be
important allergens in some European regions. Priority no. 1 was:
eggs, milk, nuts (hazelnut), fish, mollusks, peanut, apple, peach
and celery, while priority no. 2 was: kiwi, mustard, sesame, soy,
walnut and wheat.
The results of the studies are highly dependent on the geographical
area in which the research is conducted. Common allergens across
Europe are: apples and hazelnuts, then peanut, peach, celery, fish
and shrimps. The listed foods are the priority no. 1 in Europe. Milk
and egg allergies occur exclusively in children. Priority no. 2 is:
kiwi and nuts, with kiwi as a significant allergen in entire Europe.
The food of 3rd priority includes: carrot (important allergen in
Lithuania), tomato, water-melon and banana. There are also some new
allergens on the list that have not been considered a priority until
now [21].
Prevalence of food allergies in Europe - European Food Safety
Authority (EFSA) 2011, this project was conducted with similar goal
in Europe; the goal was “Gathering references and overview of
frequency of food allergy in Europe”. The project done by EFSA in
2011 directed its activities to the following: 1. Overview of
available scientific data on frequency of food allergies; 2.
Determination of concentration threshold for each allergen (where
possible); 3. Overview of available analytical methods for
determination of food allergens.
A total of 7333 articles were gathered, and 92 of them were taken
into consideration. Of that number, 52 are related to European
countries: Denmark, Estonia, Finland, France, Germany, Greece,
Hungary, Iceland, Sweden, Italy, Holland, Norway, Portugal, Spain,
Turkey and Great Britain. The studies comprised different age groups
in the population, different allergens, as well as various data
gathering and diagnosing methods. Some allergens were examined in
detail (for example: milk, peanut and fish), while for others very
little information exist (lupine and celery). When it comes to
research of individual allergens, many studies exist, but as far as
frequency of allergies is concerned, very small number of studies is
selected in which control diagnosing is conducted. By examination of
gathered studies, 27 studies were observed which gathered data on
other food allergens (which are not usual). Other reported allergens
in Europe are mainly: vegetables such as peas, tomatoes, spinach,
eggplants and carrots, then chocolate, garlic, honey, pork, black
pepper, pickles, cocoa, potato, sugar, chicken and beef. There has
also been reported certain number of allergens as a general term:
colors, additives and juices. In other regions in the world, the
following are reported as allergens: cassava, buckwheat, duck,
monosodium glutamate etc. [22]. In the research by Corinnne A. et
al. 2018, authors recommend to avoid food containing allergens,
although clinical practice changed in this view [23].
Since food allergies have a significant impact on the quality of
life of an individual, as well as of his/her family, the last
question of this survey was for the subjects to evaluate the impact
of allergy on the quality of their lives. The subjects could
evaluate the impact by means of 5 proposed answers, where the impact
is graded from “insignificant”, then “it exists, but I manage to
cope with it”, “it exists”, “I have problems often”, to the worst
scenario “I am always worried”. The largest number of subjects
evaluated that “the problem exists, but they manage to cope with it”
(34 answers, i.e. 35,4%), and the smallest number of subjects
answered “I am always worried” (10, i.e. 10,4%) (Table 2).
The concept of the quality of life may have different meanings and
generally it encompasses many factors: freedom, security, financial
opportunities, spiritual pleasure, health, quality of environment
etc. The quality of life related to health (QLRH) was defined by the
WHO in 1993 in the following way: QLRH is the individual perception
of our life in the context of culture and value system in which we
live, and in relation to our goals”. QLRH may be defined in a
variety of ways, and basically implies personal perception of
health, including physical shape, psychological status, social and
professional possibilities etc. [24].
The existing Food Allergen Labeling Guide is also being further
worked on within European Commission, and it relates to allergen
list in Annex II of Regulation on Provision of Food Information to
Consumers [25].
Considering that BiH imports food, most frequently from EU countries
or regional countries, it is important for consumers that Republic
of Croatia and Republic of Slovenia, as EU Members, had to harmonize
their legislation with EU regulations and directives. We are also
interested in the legislation of Republic of Serbia, which, even
though it is not in EU, like BiH, is trying to harmonize its
legislation with EU regulations and directives on a regular basis.
In Serbia is in force the Rulebook on “Declaration, Labeling and
Marketing of Food” (“Official Gazette” RS No. 85/2013) which has
introduced, since 2014, mandatory labeling of 14 allergens, so they
are clearly distinguished from other ingredients [26].
CONCLUSION
Results obtained on food allergy prevalence in our research in
total number of subjects, i.e. of 480 subjects, 96 (20%) of them
indicate that problem of allergy in the area of Sarajevo Canton is
significant, and frequency is within the values which are
characteristic for other regions in Europe and worldwide.
List of reported allergens mainly corresponds to the list of
obligatory allergens defined by law. The most common allergens are
dairy products (3,96%), cereals (3,33%), peanut (3,13%), nuts
(3,33%), fish with mollusks and crustaceans (2,71%), then eggs
(1,25%), soy (0,83%), mustard (0,63%), sulfur dioxide and sulfides
(0,63%), celery (0,21%) and sesame (0,21%). The only allergen not
mentioned by the subjects is lupine, the use of which is not
traditional in BiH, but may be expected in imported products.
70% of persons allergic to food showed dissatisfaction by food
labeling This high percentage of dissatisfied consumers (who also
have significant health problems) indicates the need to examine
reasons for dissatisfaction, and to start initiatives for positive
changes in accordance with consumer needs.
Considering that food allergies significantly impact life quality of
individual as well as his entire family, and adequate treatment is
non-existent, generally, this problem has to be solved in a way to
provide, for the population, the best possible conditions in which
they will be able to control themselves the type of food they
consume.
EU and BiH food regulations have been analyzed, and in relation to
food allergens. It is concluded that food regulations in BiH are
harmonized with EU regulations on a regular basis, which is of great
importance for persons allergic to food.
For food allergy related disorders there is no adequate therapy yet,
so the only way is prevention, i.e. avoidance of allergens we are
sensitive to.
REFERENCES:
- Kizis D, Siragakis G., Introduction, Food Allergen Testing,
Wiley Blackwell, 2014; 286.
- Taylor SL, The Basic of Food Allergy, Detecting allergens in
food, Woodhead Publishing Limited 2006; 292-322.
- Sihrer SH, Sampson HA., Food allergy. Journal of Allergy and
Clinical Immunology 2010;125: 116-25.
- Sampson SH, Sampson HA., Food allergy. Journal of Allergy
and Clinical Immunology 2004;113: 805-19.
- Grujić R, Alergeni u hrani, prisustvo, rizici i upravljanje
u prehrambenoj industriji, Journal of Engineering & Processing
Management, 2015; 7 (1): 7-25
- Fernández-Rivas M, Ballmer-Weber B., Food allergy: current
diagnosis and management, Managing allergens in food, Woodhead
Publishing Limited, 2007; 25-43.
- Sihrer SH, Sampson HA., Food allergy: Epidemiology,
pathogenesis, diagnosis and treatment, Journal of Allergy Clin
Immunology 2014;133: 291-307.
- Antonis Lampidonis and George Siragakis, Allergens in the
food industry: customer and legislation demands, Food Allergen
Testing Molecular, Immunochemical and Chromatographic
Techniques, John Wiley & Sons, Ltd, 2014;224.
- Kerbach S., Alldrick A.J., Crevel RW.R, Domotor L., Dunn
Galvin A., Mills E.N. C., Pfaff S., Poms R.E., Tomoskozi S and
Popping B., Protecting food allergic consumers: managing
allergens across the food supply chain, Allergen Management in
the Food Industry, John Wiley & Sons, Inc., Hoboken 2010; 33-52.
- Brandtzaeg P. The gut as communicator between environment
and host: Immunological consequences. European Journal of
Pharmacology 2011; 668( Suppl 1):S16-32. doi:
10.1016/j.ejphar.2011.07.006. Epub 2011 Jul 28.
- Pavlović N, Vlahović J, Miškulin M, Pojavnost alergija na
hranu u populaciji djece predškolske dobi s područja grada
Osijeka, Zavod za javno zdravstvo Osječko-baranjske županije,
Sveučilište u Osijeku, Medicinski fakultet, Simpozij „Hranom do
zdravlja“ 2014.
- Vrdoljak D, Miškulin M, Vlahović J, Pavlović N, Diagnostic
approach to cows milk allergy in the population of infants and
early preschoolers from the Vukovar-Srijem county. Food in
health and disease, 2014; 3(2):84-89.
- Šadić S., Maletz Čatić Z, Nutritivne alergije, Hrana u
zdravlju i bolesti, znanstveno stručni časopis za nutricionizam
i dijetetiku, 2013; 2(1): 28-35.
- Lee S., IgE-mediated food allergies in children: prevalence,
triggers, and management. Korean J. Pediatr. 2017; 60: 99-105.
- Mimi L. K. Tang, Raymond J, Mullins., Food Allergy: is
prevalence increasing? Internal Medicine Journal, 2017; 47(3):
256-261.
- Joshi P, Mofidi S, Sicherer S H. Interpretation of
commercial food ingredient labels by parents of food-allergic
children. Journal of Allergy and Clinical Immunology, 2002;
109(6): 1019–21.
- Nwaru BI1, Hickstein L, Panesar SS, Roberts G, Muraro A,
Sheikh A; EAACI Food Allergy and Anaphylaxis Guidelines Group,
Prevalence of common food allergies in Europe: a systematic
review and meta-analysis, 2014; 69(8):992-1007.
- Crevel RWR., Risk Assessment for Food Allergy, Allergen
Management in the Food Industry, John Wiley & Sons, Inc.,
Hoboken, New Jersey, 2010; 421-51.
- Prevalence of Food Allergy in Europe, EFSA supporting
publication 2013:EN-506, University of Portsmouth, 2013.
- Scot H, Sicherer, MD, and Hugh A. Sampson, MD., Food
allergy: A review and update on epidemiology, pathogenesis,
diagnosis, prevention and management. Journal of Allergy and
Clinical Immunology, 2018; 141(1): 41–58.
- Pereira B, Venter C, Grundy J, Clayton C B, Arshad S H, Dean
T. Prevalence of sensitization to food allergens, reported
adverse reactions to foods, food avoidance, and food
hypersensitivity among teenagers. J Allergy Clin Immunol, 2005;
116(4): 884–92.
- The Consumer, Health and Food Executive Agency, TNS European
Behavior Studies Consortium, ec.europa.eu/food/.../labelling_legislation_study_food-info-vs-cons-decision_2014.
- Corrine A. Keet, MD, MS, PhD, and Katrina J, Allen, MD,
PhD., Advances in food allergy in 2017, 2018; 142(6): 1719-1729.
- De Blok B.M,J., Dubois A.E.J,, Groningen, Hourihane J.O' B.
Impact of food allergies on quality of life, Managing allergens
in food, Woodhead Publishing Limited, 2007; 733-737.
- Guidelines relating to the provision of information on
substances or products causing allergies or intolerances as
listed in Annex II of Regulation (EU) No 1169/2011 on the
provision of food information to consumers
- Zrnić M, Stanković I, Đorđević B, Zakonska regulisanost
deklarisanja i označavanja hrane u zemljama EU i Srbiji,
Univerzitet u Beogradu, Farmaceutski fakultet, Katedra za
bromatologiju, Simpozij „ Hranom do zdravlja“ 2014.
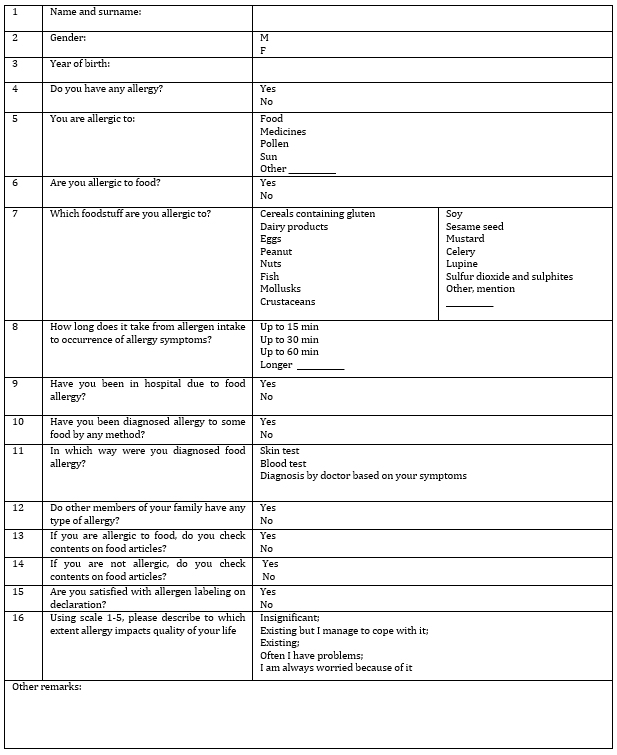
Enclosure 1: QUESTIONNAIRE – FOOD ALLERGENS
Remark: Please put X next to selected answers.
Please feel free to write at the end of questionnaire all that you
consider to be important for your allergy.
The goal of survey is to determine frequency of food allergy in
Sarajevo Canton. The data from survey are anonymous and will not be
used for any other purposes.
|
|
|
|


