| |
|
|
1. Introduction
Blood pressure variability refers to changes in blood pressure
(BP) values over a certain period of time. By definition, blood
pressure variability (BPV) is a quantitative index of spontaneous
daily and nocturnal variations in systolic and diastolic arterial BP
and has been proposed as a risk factor for inducing subclinical
damage to target organs mediated by hypertension (HMOD) [1]. Older
studies of ambulatory invasive intra-arterial pressure have shown
that BP is highly variable during the day and to a lesser extent at
night [2,3] due to the interplay of central neuro factors, humoral
influences, local vasoactive mechanisms, and the buffering effect of
baroreflexes [4,5].
While it's normal for blood pressure to vary throughout the day,
excessive variability, i.e., high blood pressure variability, may be
associated with an increased risk of heart disease, stroke, and
other complications [1]. It is well known that besides reducing the
mean arterial pressure measured by 24-hour ambulatory blood pressure
monitoring (ABPM), reducing blood pressure variability under therapy
has prognostic significance as an independent factor in stroke
prevention [1]. Episodic elevated blood pressure is associated with
more frequent cardiovascular (CV) events.
Short-term BPV is quantitatively related to the level of elevated BP
and is therefore greater in arterial hypertension than in
normotension [3] and has a detrimental effect on the development of
hypertension-mediated subclinical organ damage (HMOD) [6].
Interestingly, significant differences in blood pressure variations
exist between human and animal studies, with BPV being much lower in
experimental animals [7]. Non-invasive studies with ABPM have shown
that 24-hour BP variability has a detrimental effect on CV outcomes,
independent of 24-hour mean BP [8,9,10,11].
Left ventricular hypertrophy (LVH) as one of the most important
HMODs is a sensitive index for the level of elevated mean arterial
pressure (MAP) [12]. LVH and aortic dilation are also sensitive
indices for the level of blood pressure variability MAP [12].
Table 1. Models and mechanisms of elevated blood
pressure variability (BPV). [4,5]

The complex topic of short-term and long-term blood pressure
variability (BPV) is a factor that introduces some confusion in the
diagnosis, classification, and treatment of hypertension. The true
pathophysiological variation in blood pressure is associated with
heart rate, respiration, complex sympathetic nervous system
responses, vascular reactivity, and arterial stiffness [4,5].
Measurement errors (systematic and random errors) further complicate
the analysis of BPV. Most studies use serial clinical blood pressure
values in the office, 24-hour ambulatory blood pressure monitoring (ABPM),
or home blood pressure values (HBPM) with standard statistical
indicators (standard deviation, variance, or coefficient of
variation) (Figure 1 and 2).
Various studies have found that BPV is reduced to a small extent
with calcium antagonists and diuretics therapy and even increased
with ACE inhibitors, beta-blockers, and alpha-blockers [13,14], but
no interventional study has addressed whether reducing blood
pressure variability provides protection from cardiovascular disease
risk [11]. BPV is not specifically mentioned in the latest ESH
guidelines and practical recommendations from 2023 [15], but it is
tacitly confirmed by recommendations for repeated blood pressure
measurements, standardization of techniques, and confirmation of
hypertension diagnosis by home or ambulatory blood pressure
monitoring to explain the "white coat effect," masked hypertension,
time spent in normotension during treatment, and to avoid problems
in hypertension classification. There is no formal consensus on how
to quantify or treat elevated blood pressure variability despite the
real need for better diagnostic and therapeutic guidelines.
Therefore, doctors should focus on controlling mean blood pressure
using combinations of medications that improve cardiovascular
disease (CVD) outcomes. Future consensus guidelines should directly
address blood pressure variability and should include educational
materials for both physicians and patients [15].
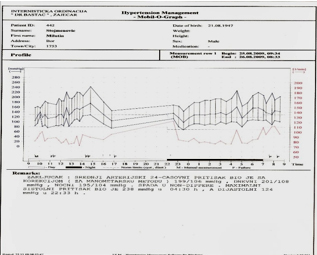
Picture 1. Example of elevated mean 24-hour blood
pressure on ABPM graph with stage 3 hypertension and increased blood
pressure variability.

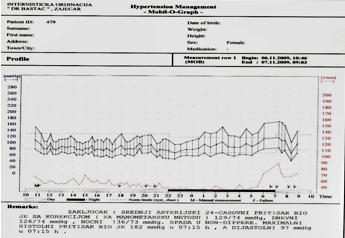
Picture 2. Ambulatory 24-hour ABPM monitoring of
blood pressure under antihypertensive therapy that is well-regulated
shows normal average arterial 24-hour BP, but there is still
increased blood pressure variability.

PATIENTS AND METHODS
This retrospective cross-sectional study included 196 hypertensive
patients under adequate therapy who underwent 24-hour ambulatory
blood pressure monitoring (ABPM). The mean 24-hour arterial pressure
for the entire group was normal at 123/76 mmHg on ambulatory blood
pressure monitoring. A total of 196 patients were examined, 109
males and 87 females, with a mean age of 49.3 ± 8.4 years, untreated
or inadequately treated patients with stage 2 hypertension (mean BP
before treatment 167/106 mmHg) who were divided into three groups
according to blood pressure variability parameter. Elevated blood
pressure variability was present in 66/196 patients (34%) - group V
despite good pressure control, while 130/169 (66%) had normal
variability - group C, control. A subgroup ExtV was specifically
identified within group V with extreme blood pressure variability (SD>20
mmHg) - 15/66 patients (8%). In addition to routine clinical
methods, ECG, office blood pressure measurements, and 24-hour ABPM,
all patients underwent echocardiography using a GE Vivid 7 DIMENSION
PRO machine with an emphasis on myocardial hypertrophy: left
ventricular mass (LVM) and left ventricular mass index (LVMI) and
parameters of left ventricular diastolic function via pulse (PW),
continuous (CW), and tissue (TDI) Doppler.
Normal geometry assumes normal LVMI (less than 134 g/m2 for males
and 110 for females), normal relative wall thickness (RWT less than
0.45), normal left ventricular end-diastolic dimension index (LVDDI
less than 3.1 cm/m2), and normal septal eccentricity index (less
than 1.3). Two-dimensional echocardiography was performed for
precise measurements on M-Mode and qualitative analysis of standard
two-dimensional (B-mode) cross-sectional planes. All parasternal
longitudinal and transverse sections, apical sections with two and
four cardiac chambers, as well as subcostal and suprasternal
sections, were routinely performed. Visual analysis of the
appearance of valvular echo apparatus, endocardium, and pericardium
was performed. Regional myocardial motion analysis was also
performed: presence or absence of hypokinesia, akinesia, or
dyskinesia, and motion nonuniformities, taking into account normal
variations. Diastolic parameters were determined by PW and TDI
Doppler, including the E and A wave velocities ratio (E/A), the
deceleration time of the A wave (DTA) representing myocardial
relaxation, and the E wave transmitral velocity/mitral annulus E'
velocity ratio on tissue Doppler representing left ventricular
compliance and indirectly left ventricular filling pressure.
Statistical analysis was performed using the Statgraphics computer
program, and the following parametric tests were used to test the
hypothesis: Student's t-test, linear correlation coefficient, and
nonparametric chi-square test.
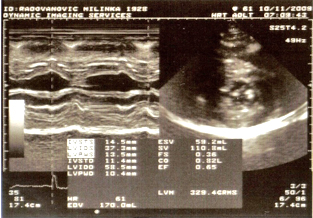
Picture 3. Example of severe hypertrophy, LVM=329
grams.

Increased blood pressure variability is represented as the
standard deviation (±SD) of blood pressure values in mmHg. Reference
threshold values for increased blood pressure variability are
categorized according to blood pressure standard deviation (±SD).
• daily systolic: >17 mmHg,
• daily diastolic: >13 mmHg,
• nocturnal systolic: >13 mmHg,
• nocturnal diastolic: >10 mmHg,
• extreme daily systolic variation: >20 mmHg.
RESULTS:
One-third of the examined patients, 66 out of 196 (34%), had
increased blood pressure variability - group V despite good pressure
control, while two-thirds of the patients, 130 out of 169 (66%), had
normal variability - group C, which served as the control group. A
subgroup ExtV was specifically identified within group V with
extreme blood pressure variability - consisting of 15 out of 66
patients (8%). Left ventricular mass index (LVMI) was elevated in
groups C (140 g/m2) and V (142 g/m2) but without statistically
significant difference (NS). Only in the group with extreme
variability of daily systolic blood pressure, the left ventricular
mass index was significantly higher compared to groups C and V
(p<0.05) (Graph 1). There was no difference regarding gender and age
structure.
GRAPH 1. Myocardial mass and diastolic function

The mean left atrial (LA) dimension, as a parameter of cardiac
diastolic function, was normal in the control group C (LA=38 mm,
normal up to 40 mm), and statistically significantly higher (p<0.01)
in groups with increased blood pressure variability (group V -
LA=45mm and ExtV - LA=47mm), but without significant differences
between them. The diastolic function, expressed as the ratio of
transmitral early diastolic filling velocity E to the average mitral
annulus velocity E’ (E/E’), was normal in group C (E/E’ = 5.4 x 10)
and statistically significantly higher in groups V (E/E’=7.2) and
ExtV (E/E’=7.5) compared to the control group C (p<0.01), although
all mean E/E’ values were within the normal range.
Statistical analysis of the examined parameters of 24-hour
ambulatory blood pressure monitoring and echocardiographic
parameters did not reveal significant correlation through
calculating the coefficient of linear correlation between mean
arterial pressure measured by 24-hour ambulatory blood pressure
monitoring and standard deviation of daily and nocturnal blood
pressure, and the degree of left ventricular myocardial hypertrophy
(linear correlation coefficients r <0.20), as expected. However,
there is a moderate but significant correlation between the best
echocardiographic parameter of diastolic function, the E/E' ratio,
and the variability of systolic daily blood pressure: r=0.41. A weak
correlation was found between the E/E' ratio and the variability of
nocturnal diastolic blood pressure (r=0.30). There is no correlation
between E/E’ and the variability of diastolic daily blood pressure
(r=0.01) and nocturnal systolic blood pressure (r=0.16).
Early morning systolic pressure determined by ambulatory blood
pressure monitoring, as an important prognostic factor, only has a
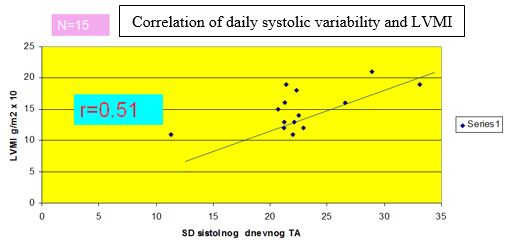
weak correlation with LVMI (r=0.39). Only the subgroup with extreme
variability ExtV in terms of daily systolic blood pressure has a
statistically significant good correlation with the degree of left
ventricular myocardial hypertrophy LVMI, r=0.51 (Graph 2).
GRAPH 2. Correlation between extreme systolic
blood pressure variability (SD>20mmHg) and LVMI

DISCUSSION
The pronounced variability in arterial blood pressure (ABP) is
intertwined and overlaps with the diagnosis of hypertension,
presenting a challenge for clinicians, as standard antihypertensive
drugs only modestly reduce ABP fluctuations, as they are a
consequence of pathophysiological changes or behavioral factors.
Clinically, ABP variability is classified into 4 main types based on
the duration of monitoring: ultra-short-term (beat-to-beat),
short-term (within 24 hours), medium-term (within a few days), and
long-term (over one month or year). Blood pressure variability is a
strong risk factor for cardiovascular disease, chronic kidney
disease, cognitive decline, and mental illness. The diagnostic and
therapeutic value of measuring and controlling blood pressure
variability can provide critical targets alongside reducing average
blood pressure in hypertensive populations. [14].
Although some studies have shown that treatment reduces 24-hour
blood pressure variability (BPV), there are no studies to date
demonstrating that lowering BPV through treatment reduces
cardiovascular risk. [8,9,16,17].
Numerous studies have focused on other types of BPV. Conflicting
results have been published regarding the prognostic value of BP
variability in-office between physician visits (inter-visit
variability) [18], while some studies have reported an association
between day-to-day variability when BPV was assessed through home
blood pressure monitoring (HBPM) and the risk of cardiovascular
outcomes [19,20]. However, the largest body of evidence for BPV
relates to office BP variability, from visit to visit over the
course of one or more years (long term). Post-hoc analyses of
antihypertensive treatment studies have shown that long-term BPV,
measured as differences between office BP readings at 6 or 12
months, is associated with cardiovascular risk in treated
hypertensive patients. In a post-hoc analysis of three studies, an
increased number of physician visits resulting in office BP being
lowered to recommended levels was associated with a proportional
reduction in cardiovascular outcomes and mortality, independent of
the average office BP achieved during the treatment period. [21-23].
Furthermore, in studies or treated cohorts of patients with various
demographic and clinical characteristics, BP variations between
physician visits are associated with cardiovascular and renal risk,
independent of mean BP values over years of treatment [24-26]. In
one study, combining the mean BP during treatment with BPV between
physician visits identified a safer cardiovascular risk profile in
treated hypertensive patients than any individual measurement [27].
These data suggest that in treated patients, protection depends on
the time spent under controlled pressure, as evidenced by the recent
confirmed relationship between cardiovascular events and the
calculated time spent within the therapeutic BP range (TTR) or other
BP burden ratios in patients undergoing renal denervation and
treated diabetics, respectively. [28,29].
From a clinical practice perspective, these data justify
recommendations to pay attention to the consistency or regularity of
BP regulation in patients on therapy, as the absence of regulation
in a given physician visit does not represent "innocent" BP
elevation without consequences, as it indicates a prolonged period
of high pressure in previous months. Evidence from the ELSA study
shows that inconsistent BP regulation is common in treated
hypertensive patients [30]. Few studies have explored the
relationship between blood pressure variability and
echocardiographic parameters of myocardial mass, systolic and
diastolic function indices [31,32,33]. Multivariable logistic
regression showed that the trend of 24-hour systolic blood pressure
burden on ABPM acts independently as a critical risk factor for LVH
development [31]. A correlation was observed between systolic blood
pressure burden and the severity of LVH in pediatric patients with
hypertension, and 24-hour SBP burden acts as a critical early
prognostic parameter for LVH [31]. Shin et al. [32] found that
patients with higher blood pressure variability showed a
significantly increased left ventricular myocardial mass index (LVMI)
and late mitral inflow velocity (A), as well as a reduced E/A ratio
(early mitral inflow velocity/late mitral flow velocity) compared to
those with lower BP variability (LVMI: p = 0.02; velocity: p <
0.001; E/A ratio: p < 0.001;). Additionally, increased blood
pressure variability was associated with higher pulse wave velocity
(PWV) and augmentation index (p < 0.001). Even among patients whose
blood pressure was well controlled, blood pressure variability
correlated with LV mass, diastolic dysfunction, and arterial
stiffness [32]. Increased blood pressure variability was associated
with LV mass and dysfunction, as well as arterial stiffness,
suggesting that blood pressure variability may be an important
determinant of target organ damage in patients with hypertension
[32].
Variability in systolic blood pressure from visit to visit is
associated with increased cardiac events [33]. Recent advances in
imaging deformation via speckle tracking allow analysis of left
atrial volume at various phases (2-DSTE) and easy measurement of
left atrial phase function (LA). However, the relationship between
BP variability and left atrial functional deformation with patient
clinical outcomes has not been sufficiently explored. Findings by
Tanaka et al. [33] suggest that high VVV-SBP is associated with
cardiovascular risk, including worsening LA function in clinical
practice.
Recent technological advancements through practical ambulatory
systems without cuffs will enable continuous, non-invasive
monitoring of blood pressure (BP), heart rate, and cardiac rhythm on
both longitudinal 24-hour measurement scales and high-frequency
blood pressure variability from beat to beat, along with synchronous
heart rate variability (HRV) and changes in baseline heart
rhythm[11,34].
CONCLUSION:
Variability in daytime systolic arterial blood pressure is now
recognized as an independent prognostic risk factor for stroke in
hypertensive patients. One-third of the examined patients, 66 out of
196 (34%), had elevated blood pressure variability (BPV) - group V
despite good pressure regulation. Comparing the examined parameters
of 24-hour ambulatory pressure and echocardiographic indexes, no
significant difference was found in the degree of left ventricular
myocardial hypertrophy, except in extreme variability (ExtV)
(P<0.01).
The left ventricular myocardial mass index (LVMI) was elevated in
groups C (140 g/m2) and V (142 g/m2) but without statistically
significant difference (NS). Only in the group with extreme
variability of daytime systolic blood pressure was the LVMI
significantly higher compared to groups C and V (p<0.05). The mean
value of left atrial dimension (LA) as a parameter of cardiac
diastolic function was normal in the control group C (LA=38 mm,
normal up to 40 mm), but statistically significantly higher (p<0.01)
in groups with elevated BPV (group V - LA=45mm and ExtV - LA=47mm),
although without significant difference between them.
Diastolic function, represented by the E/E' ratio (the ratio of
early diastolic transmitral velocity to early diastolic mitral
annulus velocity), was normal in group C (E/E' = 5.4 x 10) but
statistically significantly higher in groups V (E/E'=7.2) and ExtV
(E/E'=7.5) compared to control group C (p<0.01), although all mean
values of E/E' were within normal limits.
However, there is a moderate but significant correlation between the
best echocardiographic parameter of diastolic function, the E/E'
ratio, and the variability of daytime systolic blood pressure: r=
0.41. Only the subgroup with extreme variability (ExtV) regarding
daytime systolic blood pressure has a statistically significant
strong correlation with the degree of left ventricular myocardial
hypertrophy (LVMI), r=0.51.
Statistical analysis of the examined parameters of 24-hour
ambulatory pressure and echocardiographic parameters did not find a
significant correlation through the calculation of the linear
correlation coefficient between the mean arterial pressure measured
by 24-hour ambulatory pressure monitoring and the standard deviation
of daytime and nighttime blood pressure and the degree of left
ventricular myocardial hypertrophy (linear correlation coefficients
r <0.20), as expected.
Arterial blood pressure variability has a strong correlation with a
representative echocardiographic parameter of diastolic function
derived from tissue Doppler: the E/E' ratio r=0.41, which best
represents left ventricular diastolic dysfunction as subclinical
organ damage. Only the subgroup with extreme variability (ExtV)
regarding daytime systolic blood pressure has a statistically
significant strong correlation with the degree of left ventricular
myocardial hypertrophy (LVMI), r=0.51.
REFRENCE:
- Peter Rothwell , PM Rothwell, SC Howard, E Dolan, E O'Brien,
JE Dobson, B Dahlöf, .Prognostic significance of visit-to-visit
variability, maximum systolic blood pressure, and episodic
hypertension.The Lancet 2010;375 (9718): 895-905.
- Bevan AT, Honour AJ, Stott FH. Direct arterial pressure
recording in unrestricted man. Clin Sci 1969; 36:329–344.
- Mancia G, Ferrari A, Gregorini L, Parati G, Pomidossi G,
Bertinieri G, et al. Blood pressure and heart rate variabilities
in normotensive and hypertensive human beings. Circ Res 1983;
53:96–104.
- Joseph L. Izzo Blood Pressure Variability: Mechanisms,
Measurement, Subtypes, and Clinical Implications. EsMed MRA.
2022: 10(10).
- Mancia G. Short- and long-term blood pressure variability:
present and future. Hypertension 2012; 60:512–517.
- Frattola A, Parati G, Cuspidi C, Albini F, Mancia G.
Prognostic value of 24-h blood pressure variability. J Hypertens
1993; 11:1133–1137.
- Ding-Feng Su. Treatment of hypertension based on measurement
of blood pressure variability: lessons from animal studies. Curr
Opin Cardiol. 2006 ;21(5):486-91. doi:
10.1097/01.hco.0000240587.14463.58.
- Mancia G, Bombelli M, Facchetti R, Madotto F, Corrao G,
Trevano FQ, et al. Long-term prognostic value of blood pressure
variability in the general population: results of the Pressioni
Arteriose Monitorate e Loro Associazioni Study. Hypertension
2007; 49:1265–1270.
- Bilo G, Dolan E, O’Brien E, Facchetti R, Soranna D, Zambon
A, et al. The impact of systolic and diastolic blood pressure
variability on mortality is age dependent: data from the Dublin
Outcome Study. Eur J Prev Cardiol 2020; 27:355–364.
- Palatini P, Saladini F, Mos L, Fania C, Mazzer A, Cozzio S,
et al. Short-term blood pressure variability outweighs average
24-h blood pressure in the prediction of cardiovascular events
in hypertension of the young. J Hypertens 2019; 37:1419–1426.
- Parati G, Bilo G, Kollias A, Pengo M, Ochoa JE, Castiglioni
P, et al. Blood pressure variability: methodological aspects,
clinical relevance and practical indications for management - a
European Society of Hypertension position paper . J Hypertens
2023; 41:527–544.
- Ding-Feng Su. Treatment of hypertension based on measurement
of blood pressure variability: lessons from animal studies. Curr
Opin Cardiol. 2006 ;21(5):486-91. doi:
10.1097/01.hco.0000240587.14463.58.
- Verdecchia P and Angeli F. Reversal of Left ventricular
hypertrophy.What have recent trials Taught us. Am J Cardiovasc
Drugs 2004; 4:369-378.
- Muesian ML, Salvetti M., Monteduro C. Left ventricular
concentric geometry during treatment adversely affects
cardiovascular prognosis in hypertensive patients. Hypertension
2004;43:731-738.
- Mancia G, Kreutz R, Brunström M, Burnier M, Grassi G,
Januszewicz A, et al. 2023 ESH Guidelines for the management of
arterial hypertension The Task Force for the management of
arterial hypertension of the European Society of Hypertension:
Endorsed by the International Society of Hypertension (ISH) and
the European Renal Association (ERA). J Hypertens
2023;41(12):1874-2071. doi: 10.1097/HJH.0000000000003480.
- Sega R, Corrao G, Bombelli M, Beltrame L, Facchetti R,
Grassi G, et al. Blood pressure variability and organ damage in
a general population: results from the PAMELA study (Pressioni
Arteriose Monitorate E Loro Associazioni). Hypertension 2002;
39:710–714.
- Kollias A, Stergiou GS, Dolan E, O’Brien E. Ambulatory
arterial stiffness index: a systematic review and meta-analysis.
Atherosclerosis 2012; 224:291–301.
- Muntner P, Levitan EB, Reynolds K, Mann DM, Tonelli M,
Oparil S, Shimbo D. Within-visit variability of blood pressure
and all-cause and cardiovascular mortality among US adults. J
Clin Hypertens (Greenwich) 2012; 14:165–171.
- Stevens SL, Wood S, Koshiaris C, Law K, Glasziou P, Stevens
RJ, McManus RJ. Blood pressure variability and cardiovascular
disease: systematic review and meta-analysis. BMJ 2016;
354:i4098
- Kikuya M, Ohkubo T, Metoki H, Asayama K, Hara A, Obara T, et
al. Day-by-day variability of blood pressure and heart rate at
home as a novel predictor of prognosis: the Ohasama study.
Hypertension 2008; 52:1045–1050.
- Mancia G, Kjeldsen SE, Zappe DH, Holzhauer B, Hua TA,
Zanchetti A, et al. Cardiovascular outcomes at different
on-treatment blood pressures in the hypertensive patients of the
VALUE trial. Eur Heart J 2016; 37:955–964.
- Mancia G, Schumacher H, Redon J, Verdecchia P, Schmieder R,
Jennings G, et al. Blood pressure targets recommended by
guidelines and incidence of cardiovascular and renal events in
the Ongoing Telmisartan Alone and in Combination With Ramipril
Global Endpoint Trial (ONTARGET). Circulation 2011;
124:1727–1736.
- Mancia G, Messerli F, Bakris G, Zhou Q, Champion A, Pepine
CJ. Blood pressure control and improved cardiovascular outcomes
in the International Verapamil SR-Trandolapril Study.
Hypertension 2007; 50:299–305.
- Wang J, Shi X, Ma C, Zheng H, Xiao J, Bian H, et al.
Visit-to-visit blood pressure variability is a risk factor for
all-cause mortality and cardiovascular disease: a systematic
review and meta-analysis. J Hypertens 2017; 35:10–17.
- Hata J, Arima H, Rothwell PM, Woodward M, Zoungas S,
Anderson C, et al., ADVANCE Collaborative Group. Effects of
visit-to-visit variability in systolic blood pressure on
macrovascular and microvascular complications in patients with
type 2 diabetes mellitus: the ADVANCE trial. Circulation 2013;
128:1325–1334.
- Rothwell PM, Howard SC, Dolan E, O’Brien E, Dobson JE,
Dahlof B, et al. Prognostic significance of visit-to-visit
variability, maximum systolic blood pressure, and episodic
hypertension. Lancet 2010; 375:895–905.
- Mancia G, Schumacher H, Bohm M, Redon J, Schmieder RE,
Verdecchia P, et al. Relative and combined prognostic importance
of on-treatment mean and visit-to-visit blood pressure
variability in ONTARGET and TRANSCEND patients. Hypertension
2017; 70:938–948.
- Wang N, Harris K, Hamet P, Harrap S, Mancia G, Poulter N, et
al. Cumulative systolic blood pressure load and cardiovascular
risk in patients with diabetes. J Am Coll Cardiol 2022;
80:1147–1155.
- Mahfoud F, Mancia G, Schmieder RE, Ruilope L, Narkiewicz K,
Schlaich M, et al. Cardiovascular risk reduction after renal
denervation according to time in therapeutic systolic blood
pressure range. J Am Coll Cardiol 2022; 80:1871–1880.
- Mancia G, Parati G, Bilo G, Maronati A, Omboni S, Baurecht
H, et al. Assessment of long-term antihypertensive treatment by
clinic and ambulatory blood pressure: data from the European
Lacidipine Study on Atherosclerosis. J Hypertens 2007;
25:1087–1094.
- Wu H, Shi L, Lin Y, Zheng T. The Correlation Between ABPM
Parameters and LeftVentricular Hypertrophy in Pediatric
EssentialHypertension. Front Pediatr 2022:10:896054. doi:
10.3389/fped.2022.896054. eCollection 2022.
- Shin SH, Jang JH, Baek YS, Kwon SW, Park SD, et al. Relation
of blood pressure variability to leftventricular function and
arterial stiffness inhypertensive patients. Singapore Med
2019;60(8):427-431. doi: 10.11622/smedj.2019030. Epub 2019 Mar
11
- Tanaka S, Segawa T, Noda T, Tsugita N, Fuseya T, et al.
Assessment of visit-to-visit variability in systolicblood
pressure over 5 years and phasic left atrialfunction by
two-dimensional speckle-trackingechocardiography. PMID:
33462685. DOI: 10.1007/s00380-020-01751-5
- Sheikh J.A.B, Sobotka P.A, Garg I, Dunn J.P, Minhas A.M.K,
et al. Blood Pressure Variability in Clinical Practice: Past,
Present and the Future. of the American Heart Association.
2023;12(9):e029297 https://doi.org/10.1161/JAHA.122.029297
|
|
|
|


