| |
|
|
INTRODUCTION
It is well known that women experiencing menopause have
unfavorable cardiometabolic profile, compared to women in
reproductive age [1]. These changes are mostly attributable to
hormonal disturbances, mainly due to loss of estrogen [2].
Therefore, it is not surprising that postmenopausal women had higher
incidence of cardiometabolic disorders than premenopausal women [1,
3].
It is speculated that redistribution of adipose tissue towards
visceral region, due to hormonal changes may be the main pathogenic
entity, consequently leading to increased cardiometabolic risk [4]
in postmenopause. Increased visceral fat mass is a source of
proinflammatory adipocytokines [5-8], exerting a low-grade
inflammation environment which could predispose to the future
hypertension occurrence [9].
In addition, increased abdominal fat mass is accompanied with
increased insulin resistance [4, 8]. However, even though previous
studies confirmed the association between obesity and hypertension,
the underlying pathophysiological mechanism is not well elucidated
[10, 11]. Especially considering the fact that discordant results
were seen in literature when examining the independent role of
obesity and/or insulin resistance on risk for hypertension
occurrence and progression. Namely, some studies reported that
obesity may be associated with hypertension incidence, acting
through some other mechanisms, different from insulin signaling
pathways [10, 11].
Having this in mind, we aimed to examine if obesity [as measured
with body mass index (BMI)] has a predictive role for hypertension,
independently of insulin resistance [as measured with Homeostasis
model assessment of insulin resistance (HOMA-IR)] in the cohort of
postmenopausal women.
MATERIALS AND METHODS
Study population
The current cross-sectional study derived from our previous works
investigating the utility of examining cardiometabolic markers in
postmenopausal women [1-7].
A total of 150 postmenopausal women non-treated with medications
(among them 44.7% hypertensive) were included in cross-sectional
study. All examined women were recruited by the gynecologist in the
Center of Laboratory Diagnostics of the Primary Health Care Center
in Podgorica, Montenegro, for their regular biochemical analyses
check-up in a period from October 2012 to May 2013. Women were
considered to be postmenopausal if they reported the absence of
menstrual bleeding for more than one year.
Inclusion criteria to enter the study were: menopausal status, no
signs and symptoms of acute inflammatory disease, no history of
malignancy, non-smoking, and no any medicament therapy usage in the
last six months.
Exclusion criteria were: High sensitivity C-reactive protein (hsCRP)
>10 mg/L, diabetes mellitus, hypothyroidism or hyperthyroidism,
liver disease other than steatosis, renal dysfunction,
cardiovascular disorders, and any medications use in the last six
months.
All postmenopausal women signed informed consent. The investigation
was carried out in compliance with the Declaration of Helsinki, and
Ethical Committee of Primary Health Care Center in Podgorica,
Montenegro approved the study protocol.
Anthropometric measurements
Basic anthropometric measurements were obtained, as described
previously [4].
Biochemical analyses
Biochemical parameters were measured as described elsewhere [4].
Serum levels of glucose, lipid parameters [e.g., total cholesterol
(TC), high density lipoprotein cholesterol (HDL-c), low density
lipoprotein cholesterol (LDL-c), triglycerides (TG)], bilirubin,
uric acid,creatinine, as well as the activity of aspartat
aminotransferase (AST), alanine aminotransferase (ALT) and
gamma-glutamyl transferase (GGT), were measured
spectrophotometrically (Roche Cobas 400, Mannheim, Germany).
Levels of hsCRP were determined using an immunonephelometric assay
(Behring Nephelometer Analyzer, BN II, Marburg, Germany). HOMA-IR
was calculated, as described elsewhere [2]. Blood pressure was
measured and Glomerular filtration rate was estimated (eGFR) as
described previously [2, 3]. Hypertension was defined as
(systolic/diastolic blood pressure (BP) (≥140/≥90 mmHg) [9].
Statistical analysis
Statistical data of the study populations are presented as mean ±
standard deviation for normally distributed data, as geometric means
(95% confidence interval - CI) for log-normally distributed data
[12] and as median (interquartile range) for skewed distributed
data. Distribution of data were tested by Kolmogorov-Smirnov
statistical test. Comparisons of continuous normally and
log-normally distributed variables were performed using the
Student's t-test. Comparisons of skewed distributed data were
performed using Mann-Whitney U-test. Spearman's correlation analysis
was employed to estimate possible associations of SBP and DBP with
general and clinical parameters. Binary logistic regression analysis
was performed to assess the ability of demographic and clinical
parameters to predict hypertension in postmenopausal women.
Postmenopausal women with arterial tension defined as SBP ≥ 140 mmHg
and DBP ≥90 mmHg were coded as 1 and postmenopausal women with
arterial tension defined as SBP <140 mmHg and DBP <90 mmHg were
coded as 0. Multivariate logistic regression was performed for Model
taking into account all parameters (predictors) that showed
significant Spearman bivariate correlation with SBP and DBP. In
Model odds (OR) and 95% CI were determined for each parameter. The
explained variation in blood pressurewas given by Nagelkerke R2
coefficient of logistic regression analysis. Receiver operating
characteristic (ROC) curve analysis for Model was performed to
assess the ability of tested parameters to discriminate menopausal
women with or without hypertension. Hosmer-Lemeshow rule for
logistic models was used to test if there was a linear relationship
between the predictor variables and the log-odds of the criterion
variable (blood pressure level). The areas under the curve (AUC)
were defined as poor (0.5 ≤ AUC < 0.7), satisfactory (0.7 ≤ AUC <
0.8), good (0.8 ≤ AUC < 0.9) and excellent (AUC ≥ 0.9) [13]. All
statistical analyses were performed using PASW Statistics Version
18.0 and MedCalc version 15.8. All statistical tests were considered
when probability level was less than 0.05.
Results
The general demographic characteristics of the two study
populations are given in Table 1. There were statistical significant
differences in all parameters except for menopause duration.
Hypertensive menopausal women were older, had higher BMI, WC, SBP
and DBP than normotensive menopausal women.
Table 1. General and clinical characteristics of postmenopausal
women according to blood pressure
Tabela 1. Opšte i kliničke karakteristike ispitivanih žena u
postmenopauzi podeljenih na osnovu vrednosti krvnog pritiska

Data are presented as arithmetic mean ± SD and compared with
Student’s t-test.
*Data are presented as median (interquartile range) and compared by
Mann-Whitney U test
BMI-Body mass index; WC-Waist circumference; SBP-Systolic blood
pressure; DBP-Diastolic blood pressure
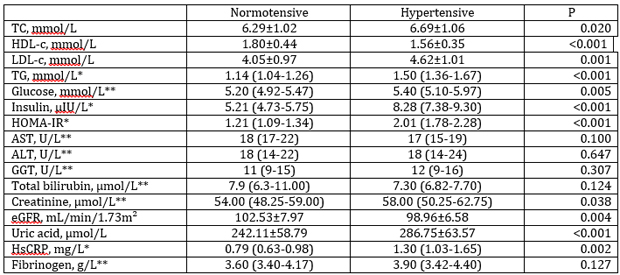
A significantly higher concentration of TC, LDL-c, TG, glucose,
insulin, HOMA-IR, creatinine, uric acid and hsCRP were evident in
the group of hypertensive than in normotensive postmenopausal women.
On the contrary, HDL-c concentration and eGFR were significantly
lower in hypertensive postmenopausal women. There were no
significant differences between normotensive and hypertensive women
when AST, ALT, ALP and GGT activities, total bilirubin and
fibrinogen concentrations were compared between tested groups (Table
2).
Table 2. Laboratory and clinical parameters of studied
postmenopausal women
Tabela 2. Laboratorijski i klinički parametri ispitivanih žena u
postmenopauzi

Data are presented as arithmetic mean ± SD and compared with
Student’s t-test
*Log-normal distributed data are presented as geometric mean (95%
CI) and compared with Student’s t-test after logarithmic
transformation
** Skewed distributed data are presented as median (interquartile
range) and compared with Mann-Whitney U test
TC-Total cholesterol; HDL-c-High density lipoprotein cholesterol;
LDL-c-Low density lipoprotein cholesterol; TG-Triglycerides;
HOMA-IR-Homeostasis model assessment of insulin resistance;
AST-Aspartat aminotransferase; ALT-Alanine aminotransferase;
GGT-Gamma-glutamil transferase; eGFR-Estimated glomerular filtration
rate; hsCRP-High-sensitivity C-reactive protein
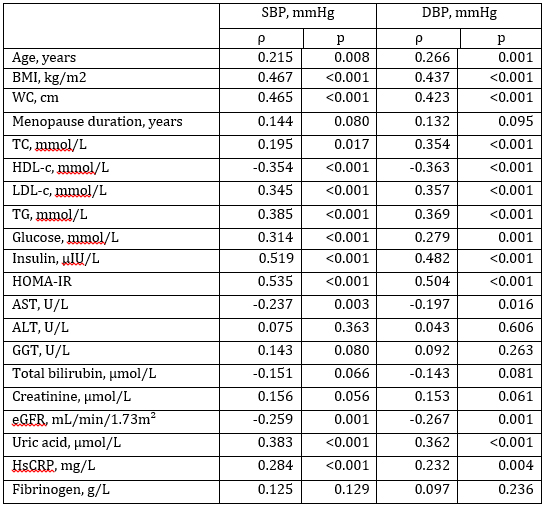
According to Spearman’s non-parametric correlation analysis
significant positive correlations were determined between both, SBP
and DBP, with age, BMI, WC, TC, LDL-c, TG, glucose, insulin,
HOMA-IR, uric acid and hsCRP (Table 3). Significant negative
correlations were determined between both, SBP and DBP, and HDL-c,
AST and eGFR.
Table 3. Associations between SBP, DBP and other clinical parameters
Tabela 3. Povezanost između sistolnog, dijastolnog krvnog pritiska i
kliničkih parametara

ρ – Spearman’s correlation coefficient
BMI-Body mass index; WC-Waist circumference; TC-Total
cholesterol; HDL-c-High density lipoprotein cholesterol; LDL-c-Low
density lipoprotein cholesterol; TG-Triglycerides;
HOMA-IR-Homeostasis model assessment of insulin resistance;
AST-Aspartat aminotransferase; ALT-Alanine aminotransferase;
GGT-Gamma-glutamil transferase; eGFR-Estimated glomerular filtration
rate; hsCRP-High-sensitivity C-reactive protein
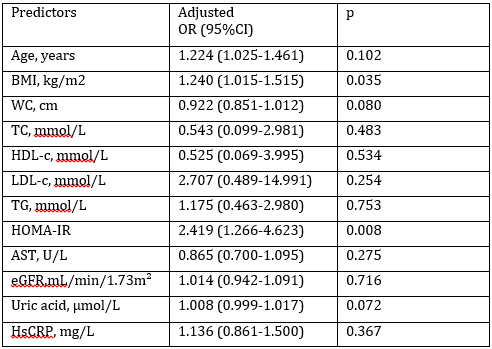
Multivariate logistic regression analysis was used to establish the
independent associations of blood pressure and tested parameters
which showed significant correlations with SBP and DBP (Table 4).
Those predictors were age, BMI, WC, TC, HDL-c, LDL-c, TG, HOMA-IR,
AST, eGFR, uric acid, and hsCRP.Hosmer-Lemeshow rule for logistic
models showed that there was a linear relationship between the
predictor variables and the log-odds of the blood pressure levels
(Chi-squared value was 8.200, p=0.414). Although, glucose and
insulin concentrations showed significant correlations with SBP and
DBP, they were excluded from multivariate logistic regression
analysis because they entered equation for HOMA-IR calculation.
Adjusted ORs for tested parameters were shown in Table 4. BMI and
HOMA-IR were shown to be the independent predictors of blood
pressure in postmenopausal women (OR=1.240, p=0.035 and OR=2.419,
p=0.008, respectively). Rise in BMI for 1 kg/m2 enhanced the
probability for higher blood pressure by 24%. Also, elevation in
HOMA-IR for 1 unit, rose the probability for higher blood pressure
almost 2.5 times. Adjusted Nagelkerke R2 coefficient for the Model
was 0.470, which means that 47% of variation in blood pressure could
be explained with this Model. Also, this Model correctly classified
76% of postmenopausal women having hypertension.
Table 4. Odds ratios (OR) after multivariate logistic regression
analysis for parameters predicting abilities towards blood pressure
Tabela 4. Statistička verovatnoća nakon multivarijantne logističke
regresione analize za predikciju krvnog pritiska

BMI-Body mass index; WC-Waist circumference; TC-Total
cholesterol; HDL-c-High density lipoprotein cholesterol; LDL-c-Low
density lipoprotein cholesterol; TG-Triglycerides;
HOMA-IR-Homeostasis model assessment of insulin resistance;
AST-Aspartate aminotransferase; eGFR-Estimated glomerular filtration
rate; hsCRP-High-sensitivity C-reactive protein
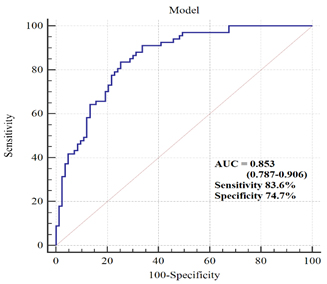
ROC analysis was used to discriminate postmenopausal women with
hypertension from normotensive ones. When the Model tested in
multivariate logistic regression analysis was used in ROC analysis,
the clinical accuracy for diagnostic procedure was good (AUC=0.853;
95%CI 0.787-0.906; SE= 0.030). As well, this diagnostic procedure
had sensitivity of 83.6% and specificity of 74.7% (Figure 1).
Figure 1. ROC curve of Model discriminating
ability between normotensive and hypertensive postmenopausal women
Slika 1. ROC kriva Modela za sposobnost diskriminacije između
normotenzivnih i hipertenzivnih žena u postmenopauzi

Discussion
Our study demonstrated that non-treated hypertensive
postmenopausal women had higher anthropometric indices (Table 1),
unfavorable lipid profile and HOMA-IR, as well as higher
inflammation level (Table 2) as compared with normotensive
counterparts. In addition, those women displayed higher uric acid
level and lower level of eGFR (Table 2). However, multivariate
logistic regression analysisrevealed that both, BMI and HOMA-IR were
the independent predictors of blood pressure in postmenopausal women
(OR=1.240, p=0.035 and OR=2.419, p=0.008, respectively), (Table 4).
Rise in BMI for 1 kg/m2 enhanced the probability for higher blood
pressure by 24%. Also, elevation in HOMA-IR for 1 unit, rose the
probability for higher blood pressure almost 2.5 times. In addition,
even 47% of variation in blood pressure could be explained with this
Model. Also, this Model correctly classified 76% of postmenopausal
women having hypertension, which is of great importance concerning
the fact that hypertension is often undiagnosed and untreated,
leading to serious health consequences [14].
Furthermore, ROC analysis was used to discriminate postmenopausal
women with hypertension from normotensive ones. When the Model
tested in multivariate logistic regression analysis was used in ROC
analysis, the clinical accuracy for diagnostic procedure was good
(AUC=0.853). As well, this diagnostic procedure had sensitivity of
83.6% and specificity of 74.7% (Figure 1).
Contradictory research results were observed when examining the
independent role of obesity and/or insulin resistance on risk for
hypertension. Namely, some studies reported independent relationship
between obesity and hypertension incidence, acting through some
other mechanisms, different from insulin signaling pathways [10,
11]. In line with this, Faria et al. [10] demonstrated the
association between visceral fat and blood pressure, whereas No
relationship between blood pressure levels and HOMA-IR was shown.
Similar results were obtained from the study conducted by Lytsy et
al. [15] in the cohort of middle-aged and elderly men, confirming
that overweight/obesity without insulin resistance increases the
risk of hypertension.
On the other hand, our results are similar with the results of Ben
Ali et al. [11], which reported the independent influence of both
obesity and HOMA-IR on blood pressure in postmenopausal women.
Insulin resistance as the link between obesity and hypertension is
well established, since hyperinsulinemia may enhance sympathetic
activity and sodium tubular reabsorption [8, 16].
However, some other mechanisms, different from insulin signaling
pathways have been also proposed to cause hypertension development
[17, 18]. One possible mechanism lays in the explanation that sodium
retention may result from disturbances in the kidney tissue, due to
a compressive effect of the enlarged visceral fat [19]. This further
results in an hyperactivity of the renin angiotensin system and
consequent increase in sodium reabsorption. This hypothesis is
further supported by some studies which demonstrated a significant
relationship between the amount of visceral fat and systolic blood
pressure [10].
Furthermore, some studies suggest that the presence of a low-grade
inflammation could predict the future onset of hypertension [9].
Lukic et al. [9] showed that increases in inflammation might be an
important factor influencing the occurrence of hypertension in obese
patients with diabetes, but which was associated with the rise in
interleukin-6 (IL-6).
Another pathogenic mechanism of hypertension onset may be attributed
to the role of arterial stiffening which precedes the hypertension
occurrence [20]. In this regard, it was suggested that low-grade
inflammation may contribute to arterial stiffness, since the
impairments in pulse wave velocity, a measure of large vessels
distension ability, were correlated with the increases in
circulating levels of IL-6 and tumor necrosis factor (TNF)-α [21,
22]. Furthermore, there are assumptions that pro-inflammatory
cytokines may exert a direct pathogenic influence on vascular tone
regulation leading to the hypertension development [23].
In our study, hypertensive postmenopausal women displayed higher
level of inflammation (as measured with hsCRP), and it correlated
well with both systolic and diastolic blood pressure in Spearman's
non-parametric correlation analysis (Table 3). However, this
association was dependent on both, BMI and HOMA-IR in our study
(Table 4).
Indeed, exogenous administration of TNF-α or IL-6 resulted in
enhanced insulin resistance, suggesting that many cytokines may act
in synchrony manner to induce this process [23]. In addition,
enlarged adipose tissues is significant contributor of increased
pro-inflammatory cytokines in circulation [4, 5, 8], thus further
leading to decreased insulin sensitivity.
A small sample size and cross-sectional design are some limitations
of our study. However, our cohort comprised of normotensive and
non-treated hypertensive postmenopausal women, so we excluded
medicines as confounding factors when estimating cardiometabolic
profile of hypertensive group. Future longitudinal studies are
needed to further explore patophysiological mechanisms related to
hypertension onset and to find the best therapeutic target approach
for its complications.
Conclusion
Non-treated hypertensive postmenopausal women exerted unfavorable
cardiometabolic profile, compared to normotensive counterparts.
Both, body mass index and insulin resistance were the independent
predictors of blood pressure in postmenopausal women.
Acknowledgement
This work was financially supported in part by a grant from the
Ministry of Education, Science and Technological Development,
Republic of Serbia (Project number 175035).
Conflict of Interest Statement
The authors declared no conflicts of interest.
REFERENCES
- Jovanović M, Klisić A, Kavarić N, Škerović V. Prevalence of
metabolic syndrome among postmenopausal women in
Montenegro-relation to hyperuricemia. Timoč med glas 2016;
41(3): 196-202.
- Klisic A, Kotur-Stevuljevic J, Kavaric N, Martinovic M,
Matic M. The association between follicle stimulating hormone
and glutathione peroxidase activity is dependent on abdominal
obesity in postmenopausal women. Eat Weight Disord – St DOI:
10.1007/s40519-016-0325-1.
- Klisic A, Kotur-Stevuljevic J, Kavaric N, Matic M.
Relationship between cystatin C, retinol-binding protein 4 and
Framingham risk score in healthy postmenopausal women. Arch Iran
Med 2016; 19(12): 845-851.
- Klisic A, Kavaric N, Jovanovic M, Soldatovic I,
Gligorovic-Barhanovic N, Kotur-Stevuljevic J. Bioavailable
testosterone is independently associated with fatty liver index
in postmenopausal women. Arch Med Sci 2017; 5 (13): 1188–1196.
- Klisic AN, Vasiljevic ND, Simic TP, Djukic TI, Maksimovic
MZ, Matic MG. Association between C-reactive protein,
anthropometric and lipid parameters among healthy normal weight
and overweight postmenopausal women in Montenegro. Lab Med 2014;
45(1): 12-16.
- Klisić A,Kotur-Stevuljević J, Kavarić N, Jovanović M,
Škerović V. Correlation between fibrinogen level and
cardiometabolic risk factors in overweight/obese postmenopausal
women. Timoč med glas 2016; 41(2): 83-90.
- Klisić A, Kotur-Stevuljević J, Kavarić N, Jovanović M. The
influence of obesity on serum uric acid level in postmenopausal
women. Timoč med glas 2016; 41(1): 20-26.
- Klisić A, Jovanović M, Kavarić N, Škerović V. Retinol
vezujući protein 4 i hiperinsulinemija kao veza između
gojaznosti i kardiovaskularnih bolesti. Timoč med glas 2017; 42
(1): 42-47.
- Lukic L, Lalic NM, Rajkovic N, Jotic A, Lalic K, Milicic T,
et al. Hypertension in obese type 2 diabetes patients is
associated with increases in insulin resistance and IL-6
cytokine levels: potential targets for an efficient preventive
intervention. Int J Environ Res Public Health
2014;11(4):3586-3598.
- Faria AN, Ribeiro Filho FF, Gouveia Ferreira SR, Zanella MT.
Impact of visceral fat on blood pressure and insulin sensitivity
in hypertensive obese women. Obes Res 2002;10(12):1203-1206.
- Ben Ali S, Belfki-Benali H, Ahmed DB, Haddad N, Jmal A,
Abdennebi M, et al. Postmenopausal hypertension, abdominal
obesity, apolipoprotein and insulin resistance. Clin Exp
Hypertens 2016;38(4):370-374.
- Bland JM, Altman DG. Transformations, means and confidence
intervals. BMJ 1996;312:1079.
- Swets JA. Measuring the accuracy of diagnostic systems.
Science 1988; 240:1285–1293.
- Wang W, Lee ET, Fabsitz RR, Devereux R, Best L, Welty TK, et
al. A longitudinal study of hypertension risk factors and their
relation to cardiovascular disease: the Strong Heart Study.
Hypertension 2006;47(3):403-409.
- Lytsy P, Ingelsson E, Lind L, Arnlöv J, Sundström J.
Interplay of overweight and insulin resistance on hypertension
development. J Hypertens 2014;32(4):834-849.
- Berne C. Insulin resistance in hypertension—a relationship
withconsequences? J Intern Med 1991;229(suppl 2):65–73.
- Hall JE, Zappe D, Kassab S. Mechanisms of obesity induced
hypertension. News Physiol Sci 1996;11:255–261.
- Hall JE, Brands MW, Zappe DH, Alonso-Galicia M. Insulin
resistance, hyperinsulinemia and hypertension: causes,
consequences or merely correlations? Proc Soc Exp Biol Med
1995;208:317–329.
- Hall JE. Renal and cardiovascular mechanisms of hypertension
in obesity. Hypertension Dallas 1994;23:381–394.
- Pirro M, Schillaci, G, Savarese G, Gemelli F, Mannarino MR,
Siepi D, et al. Attenuation of inflammation with short-term
dietary intervention is associated witha reduction of arterial
stiffness in subjects with hypercholesterolaemia. Eur J
Cardiovasc PrevRehabil 2004; 11: 497–502.
- Egan BM. Insulin resistance and sympathetic nervous system.
Curr Hypertens Rep 2003; 5: 247–254.
- Frontoni S, Bracaglia D, Gigli F. Relationship between
autonomic dysfunction, insulinresistance and hypertension, in
diabetes. Nutr Metab Cardiovasc Dis 2005; 15: 441–449.
- Badawi A, Klip A, Haddad P, Cole DEC, Garcia Bailo B,
El-Sohemy A, et al. Type 2 diabetes mellitus and inflammation:
Prospects for biomarkers of risk and nutritional intervention.
Diabetes Metab Syndr Obes 2010;3:173-186.
|
|
|
|


